Affirmative Action Battle Fails Oppressed Nation Youth

A similar law in California was upheld by the 9th U.S. Circuit Court of Appeals, leaving conflicting legal rulings for different parts of the country. It is likely that these cases will move to the Supreme Court. Six states besides Michigan have banned affirmative action in school admissions: Washington, Nebraska, Arizona, New Hampshire, California and Florida.
Debates over affirmative action in Amerika provide revolutionaries with an opportunity to talk about the history of national oppression and the reality of ongoing oppression today. But we need to be careful not to get caught up in the details of affirmative action alone. Based on college admissions information and population statistics, in recent years oppressed nations are actually attending college at rates that are approaching those of their white counterparts. But the story missing here is what’s happening to the rest of the Blacks and Latinos who don’t attend college, as well as which colleges each nation is attending. Affirmative action would impact the latter problem, but has no affect on the close to 50% of Black and Latino students who don’t make it to high school graduation.
From 1976 to 2010, the percentage of Latino college students rose from 3 percent to 13 percent, and the percentage of Black college students rose from 9 percent to 14 percent. During the same period, the percentage of white college students fell from 83 percent to 61 percent. As the table below shows, the percent of Blacks and Latinos in the college student body overall in the U.$. is approaching their representation in the population.(2)
| Nation | 1976 % of student body | 2010 % of student body | 2010 % of population (age 18-24) |
|---|---|---|---|
| white | 83% | 61% | 60% |
| Black | 9% | 14% | 15% |
| Latino | 3% | 13% | 18% |
Another relevant measure of college education equality is the percentage of 18-24-year-olds enrolled in college. For 2008 the rates by nationality were(3):
| “Race” | 2008 % w/college education(age 18-24) |
|---|---|
| white | 44.2% |
| Black | 32.1% |
| Hispanic | 25.8% |
Clearly there are still wide disparities in educational access as well
as the degrees that oppressed nation students are achieving relative to
their white counterparts. And a long history of differential college
education leads to population statistics that reflect the overall lower
educational achievement of oppressed nations. The table below shows the
percent of the population with each degree by nationality.(3) The total
percentages of each nation with a college degree should get closer
together if oppressed nation enrollment continues to approach the
population distribution. But that won’t necessarily result in the same
levels of education achieved.
| “Race” | Associate’s | Bachelor’s | Master’s | Professional degree |
|---|---|---|---|---|
| white | 9.3% | 21.1% | 8.4% | 3.1% |
| Black | 8.9% | 13.6% | 4.9% | 1.3% |
| Hispanic | 6.1% | 9.4% | 2.9% | 1.0% |
The debate over affirmative action at the college level gets at the core of what equality is. Those who demand “blind” admissions practices have to pretend that everyone applying for college admissions had equal opportunities up to the point of college application. And this gives us a chance to challenge people on what many like to call a “color-blind” society. Even looking at the privileged Blacks and Latinos who went to schools good enough to qualify them to apply for college admission, pretending equality is only possible if we ignore all the aspects of oppression that these groups face in the U.$., from overt racial hatred to subtle cultural messages of inferiority. Society sets oppressed nation youth up for failure from birth, with TV and movies portraying criminals as Black and Latino and successful corporate employees as white. These youth are stopped by cops on the streets for the offense of skin color alone, looked at suspiciously in stores, and presumed to be less intelligent in school.
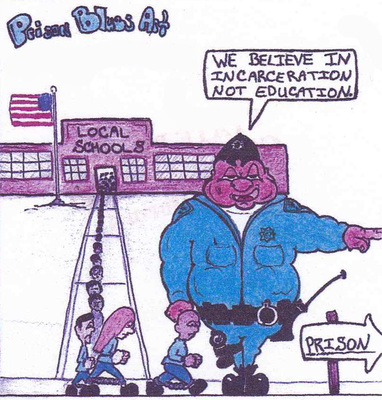
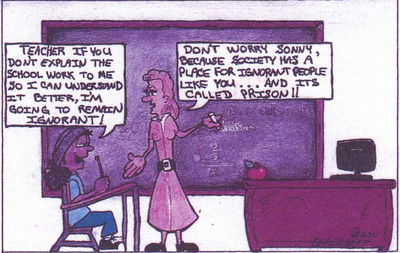
But the real problem is not the privileged Black and Latino students qualified to apply for college admission. These individual students from oppressed nations who are able to achieve enough to apply to colleges that have admissions requirements are a part of the petty bourgeoisie. The reality is very different for the other half of the oppressed nation youth who are tracked right out of college from first grade (or before) and have no chance of even attending a college that has admissions requirements beyond a high school diploma.
Among the students who entered high school in ninth grade, 63% of
Latinos, 59% of Blacks and 53% of First Nations graduated high school in
2009. This is compared to 81% of Asians and 79% of whites. Overall the
Black-white and Latino-white graduation rate gap narrowed between 1999
and 2009 but is still very large.(4)

Few statistics are gathered on drop out rates between first grade
and ninth grade, but state-based information suggests that middle school
drop out rates are high. These no doubt reflect the differentials by
nationality, leading to an even higher overall drop out rate for
oppressed nations. It is almost certain that fewer than half of Blacks
and Latinos who enter grade school complete 12th grade with a diploma.
And the students who do graduate come away with an education so inferior
that many are not qualified for college. On average, Black and Latino
high school seniors perform math and read at the same level as
13-year-old white students.(5) This is not preparation sufficient for
competitive college applications.
History of Amerikan School Segregation
The history of segregation in Amerikan schools mirrors the history of segregation and national oppression in the country as a whole. Access to education is a core value that Amerikans claim to embrace. While harshly criticizing the idea of free health care or other government-sponsored services, eliminating free education is a concept only a small group of Amerikans openly advocate. But equal access to K-12 education is an idea that has never been reality for the oppressed nations within the United $nakes. And the differentials in education are so stark that it is virtually impossible for those attending the segregated and inferior schools reserved for Amerika’s oppressed nations to overcome these years of training and lack of good schooling to participate and compete as adults in the workforce.
In the late 1950s, after the landmark Supreme Court Brown vs. Board of Education ruling, Amerikan public schools took significant steps towards desegregation. Through the late 1980s, with the use of bussing and other policies, the proportion of Black and Latino students in majority white schools increased and opportunities for education opened up to many oppressed nation youth. But during the 1990s this progress began to reverse and the trend has continued so that today segregation in public schools is worse than it was in the 1960s.
This re-segregation is the result of government rollbacks in federal programs, Supreme Court limitations on desegregation, and active dismantling of integration programs. Essentially, the government determined that desegregation requirements could be ignored. This was partly due to shifting political winds, but MIM(Prisons) looks at the timeline for this re-segregation and finds no surprise that the timing coincides with the crushing of the national liberation movements within U.$. borders in the 1970s. As the public outcry against national oppression receded, with leaders either dead or locked up, and guns and drugs circulating widely to distract the lumpen, the re-segregation of schools was a logical result. And this segregation of schools is among the most obvious aspects of the ongoing national segregation within U.$. borders.
Jonathan Kozol, in his book Segregation in Education: The Shame of the Nation, cites school after school, across the country, with atrocious facilities, in dangerous and unhealthy buildings, insufficient space, non-functioning utilities, and lack of educational materials, serving almost exclusively Black and Latino students. Many of these youth drop out of school before graduating high school. White families flee the school districts or send their kids to private schools. School “choice” has enabled greater segregation by offering options to these white kids that the oppressed nation students can’t take advantage of. While “choice” is theoretically open to everyone, it is the wealthy white families who learn about the opportunities for the best schools from their neighbors, friends and co-workers, and who know how to navigate the complexities of the application process. And often knowing someone within the school helps to get their kids admitted to the schools with particularly high demand.(6)
The government reaction to the falling skills and education of segregated schools has been to implement “standards” and “tests” and “discipline” that they pretend will make these schools separate but equal. Yet no progress is seen, and the conditions in these schools continues to worsen. The changes in requirements for underfunded and predominantly Black and Latino schools has resulted in two very different education systems: one for whites which includes cultural classes in art, drama and music, time for recess, and classes that allow for student creativity; and another for oppressed nationalities that includes strict military-like discipline, long school days with no recess, rigid curriculum that teaches to very limited standards, elimination of “fluff” classes like art and music, all taught in severely limited facilities with enormous class sizes. This divergence between the school districts reinforces segregation as white parents can see clearly what their kids miss out on (and are forced to participate in) when they don’t attend “white” schools.
According to Kozol, “Thirty-five out of 48 states spend less on students in school districts with the highest numbers of minority children than on students in the districts with the fewest children of minorities. Nationwide, the average differential is about $1,100 for each child. In some states – New York, Texas, Illinois, and Kansas for example – the differential is considerably larger. In New York… it is close to $2,200 for each child.” If these numbers are multiplied out to the classroom level, typical classroom funding for low income schools is on the magnitude of $30k to $60k less than for high income classes. At a school level these financial differences are staggering: a 400 student elementary school in New York “receives more than $1 million less per year than schools of the same size in districts with the fewest numbers of poor children.”(7) There is an even greater differential when low income oppressed nation districts are separated from low income white districts. There are a few low income white districts but they get more funding than low income oppressed nation districts and so pull up the average funding of low income districts overall.
The achievement gap between Black and white children went down between the Brown v Board of Education ruling and the late 1980s. But it started to grow again in the early 1990s. By 2005, in about half the high schools (those with the largest concentration of Blacks and Latinos) in the 100 largest districts in the country less than half the students entering the schools in ninth grade were graduating high school. Between 1993 and 2002 the number of high schools with this problem increased by 75%. These numbers, not surprisingly, coincide with a drop in Black and Latino enrollment in public universities.(8)
Kozol ties the history of re-segregation back to a U.S. Supreme Court ruling on March 21, 1973, (Edgewood Independent School District v. Kirby) when the Court overruled a Texas district court finding that inequalities in districts’ abilities to finance education are unconstitutional. This was a key class action law suit, in which a very poor non-white neighborhood argued that their high property taxes were insufficient to provide their kids with adequate education while a neighboring rich white district with lower property taxes was able to spend more than twice the amount on students. In the Supreme Court decision Justice Lewis Powell wrote “The argument here is not that the children in districts having relatively low assessable property values are receiving no public education; rather, it is that they are receiving a poorer quality education than available to children in districts having more assessable wealth.” And so he argued that “the Equal Protection Clause does not require absolute equality.”(9) This means states are not required to provide funds to help equalize the educational access of poorer people. And because of the tremendous segregation in schools, these poorer students are generally Black and Latino.
Ongoing Reality of School Segregation Today
The Civil Rights Project at UCLA does a lot of research on segregation in education in the United $tates. In a September 19, 2012 report they provide some statistics that underscore the growing segregation in public schools.(10) This segregation is particularly dramatic in the border states and the south, and segregation is especially severe in the largest metropolitan areas. They note that desegregation efforts between the 1960s to the late 1980s led to significant achievements in addressing both segregation itself and racial achievement gaps, but the trend reversed after a 1991 Supreme Court ruling (Board of Education of Oklahoma City v. Dowell) that made it easier to abandon desegregation efforts.(11)
Key facts from the Civil Rights Project 2012 report include:
-
“In the early 1990s, the average Latino and black student attended a
school where roughly a third of students were low income (as measured by
free and reduced price lunch eligibility), but now attend schools where
low income students account for nearly two-thirds of their
classmates.”
-
“There is a very strong relationship between the percent of Latino
students in a school and the percent of low income students. On a scale
in which 1.0 would be a perfect relationship, the correlation is a high
.71. The same figure is lower, but still high, for black students (.53).
Many minority-segregated schools serve both black and Latino students.
The correlation between the combined percentages of these underserved
two groups and the percent of poor children is a dismaying .85.”
-
In spite of the suburbanization of nonwhite families, 80% of Latino
students and 74% of Black students attend majority nonwhite schools
(50-100% oppressed nations). Out of those attending these nonwhite
schools, 43% of Latinos and 38% of Blacks attend intensely segregated
schools (those with only 0-10% of whites students). And another segment
of these segregated students, 15% of Black students, and 14% of Latino
students, attend “apartheid schools”, where whites make up 0 to 1% of
the enrollment.
-
“Latino students in nearly every region have experienced steadily rising
levels of concentration in intensely segregated minority settings. In
the West, the share of Latino students in such settings has increased
fourfold, from 12% in 1968 to 43% in 2009… Exposure to white students
for the average Latino student has decreased dramatically over the years
for every Western state, particularly in California, where the average
Latino student had 54.5% white peers in 1970 but only 16.5% in 2009.”
-
“Though whites make up just over half of the [U.S. school] enrollment,
the typical white student attends a school where three-quarters of their
peers are white.”
The overwhelming evidence that school segregation continues and even grows without concerted efforts around integration provides evidence of the ongoing segregation between nations overall within the United $tates. Even with residential patterns shifting and neighborhoods integrating different nationalities, families still find ways to segregate their children in schools.
The dramatic school segregation in the United $tates points to both a national and class division in this country. First there is the obvious national division that is reinforced by school segregation, which places whites in a position of dramatic privilege relative to Blacks and Latinos. This privilege extends to poorer whites, underscoring the overall position of the oppressor nation. But there is also a class division within the oppressed nations in the United $tates. The education statistics put about half of oppressed nation youth tracked into the lower class, while the other half can expect to join the petit bourgeoisie which constitutes the vast majority of the Amerikan population. Our class analysis of Amerikan society clearly demonstrates that even the lower class Blacks and Latinos are not a part of the proletariat. But a portion of these undereducated youth are forced into the lumpen class, a group defined by their exclusion from participation in the capitalist system. Future articles will explore the size and role of this lumpen class.
Related Articles:This article referenced in:


